Compare Put Option Strikes
Today we’ll compare put option strikes on our MBUU position. We’re selling these puts to earn passive income selling stock options. We currently own 600 shares of MBUU in this portfolio and we have some contracts expiring worthless today.
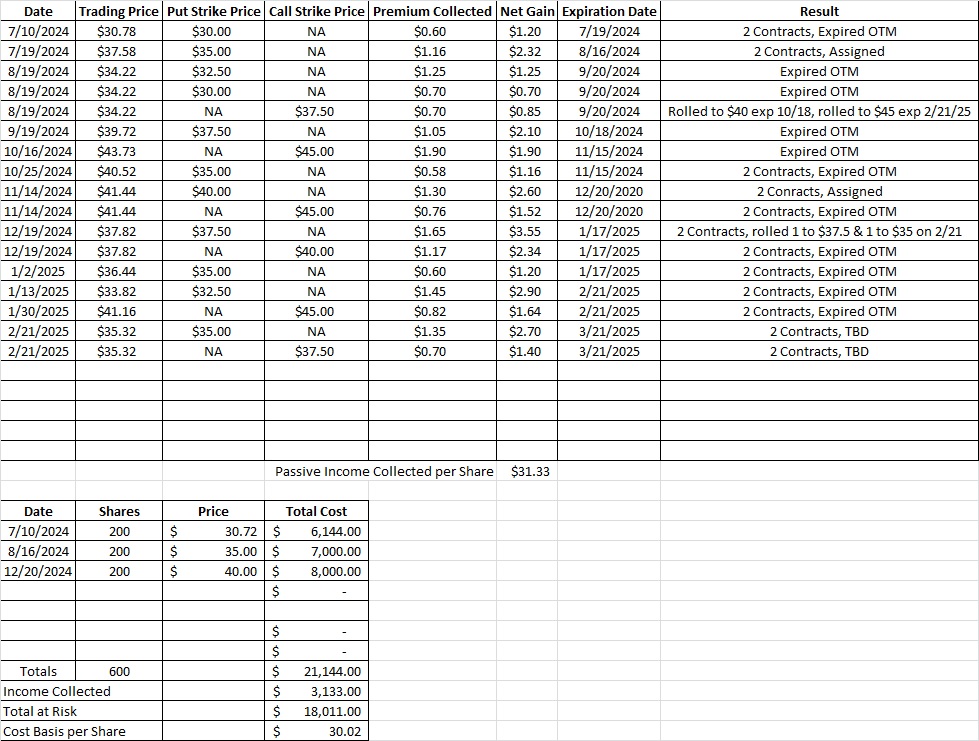
Back on 1/13 we sold to open two of the $32.50 cash secured put option contracts. We generated $1.45 per share for each of those contracts. With MBUU trading over our strike price those contracts will expire out of the money today, 2/21. So we’re keeping the premium and we’ll have access to that capital again. We also have two contracts of the $45 covered call option. We brought in $1.64 per share on each of those contracts. Those calls also expire today, and with MBUU trading below our strike we’ll keep both that premium and our shares. Selling these option contracts has brought our basis on MBUU down to $30.70 per share. Here are the posts where we walk through selling to open the cash secured put option and the covered call.
Today we’re selling to open another cash secured put option position. By selling to open an option contract on a company we want to own at a price we’re happy to own it we create passive income. We can earn this passive income in a rural area or living in a city. Either way, all we need is a laptop with an internet connection.
The next expiration date for MBUU option contracts is 3/21. That’s one month from today. Since there are twelve months in a year, our time multiplier is 12. Now we’ll compare put option strike prices and premium. We’ll divide the premium we bring in by the strike price. The strike price is the capital we’re risking by entering the trade. Then we’ll multiply that by our time multiplier, and that will give us our annualized return on our capital.
The $32.50 put option has a bid of $0.25 and an ask of $0.55. We can probably get right between those, or $0.40 if we sell to open that contract. So we divide $0.40 by the $32.50 strike and we get 0.012. Then multiply that by our time multiplier, which is 12, and we get 0.148. That’s an annualized return of 14.8% if we were to risk our capital on a similar trade throughout the year. Now let’s compare that put option strike to a different strike.
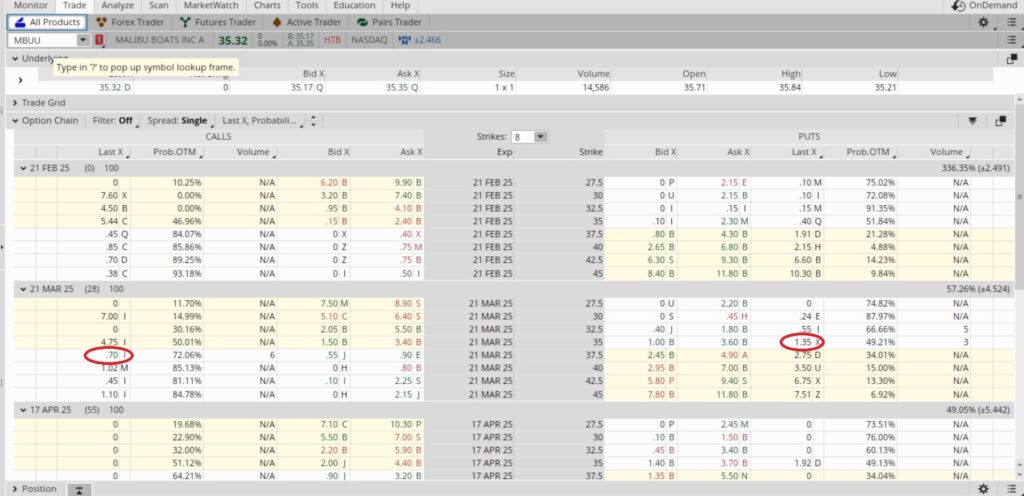
The $35 put for that same 3/21 expiration date has a bid of $0.90 and an ask of $2.60. If we split the difference between those we get $1.75. But with a spread that large between the big and the ask we don’t think it’s likely to fill there. So we split the difference again between that midpoint and the ask of $0.90, and we get $1.32. So if we are able to fill the trade at $1.35 that math would look like this: $1.35 divided into $35 = 0.386. Then we multiply that by our time multiplier of 12 and we get 0.463. That’s an annualized return of 46.3%.
We like a 46.3% annualized return more than the 14.8% on the $32.50 strike. More important than the annualized return is the fact we’re happy to take more shares of MBUU at $35. When we compare put option strikes and their premium we’re able to objectively see which one meets our objective better. So we sold to open two contracts of the $35 put. Here is the tool we use to do that math.
We also sold to open two covered calls at the $37.50 strike on the 3/21 expiration date. We brought in $0.70 per share in passive income on each of those contracts. We’re selling the calls here because we want to generate cash flow selling options. If MBUU runs up through our strike we can either let the shares go at a profit or roll the position. Our primary objective is to generate passive income selling the stock option contract, not have the shares called away.
Selling to open these put option contracts bring our basis on MBUU down to $30.02 per share.