Create Income Trading Stocks
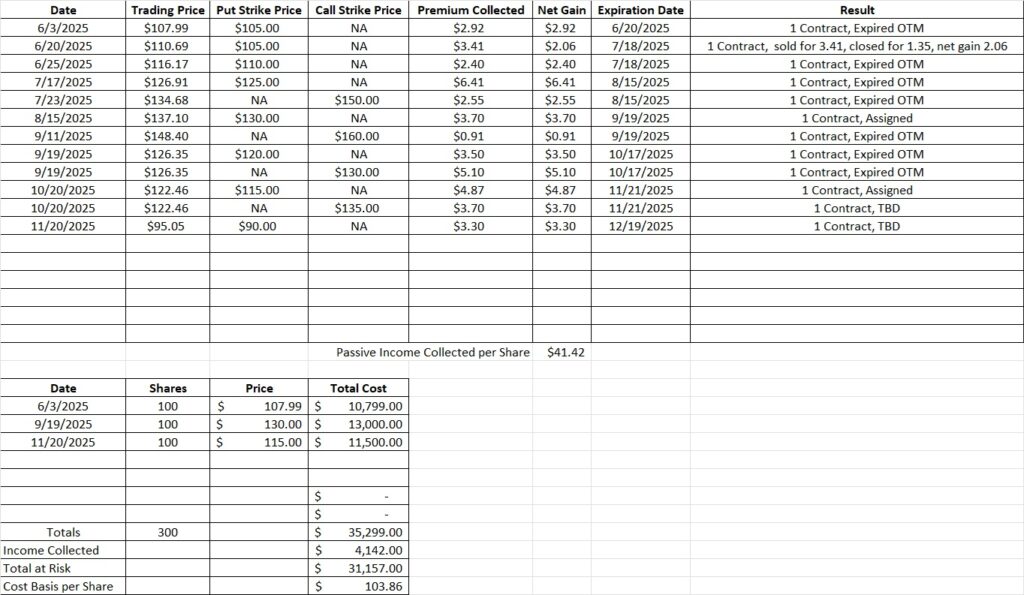
Today we’re going to walk through a trade we do to create income trading stocks. We currently own 200 shares of BLDR in this portfolio with a basis of $99.94 per share. We had a cash secured put option on BLDR at the $115 strike for the 11/21 expiration date. Here’s the post that walks through that trade. And here is the post that discusses our previous profitable option trade on BLDR.
With BLDR trading below that $115 price level our contract was assigned early and we bought 100 shares at $115 per share. We now have those shares in our account. That brings our basis on BLDR to $104.96 per share. We have room for about $60,000 worth of BLDR in this portfolio, and we’re currently around half of that allocation. So we’re going to look at selling another cash secured put option.
On the price chart below we can see a resistance line for BLDR around $93. This chart is a three year chart with weekly candles. We can see that BLDR hovered around this trading price for about a month back in April of ’23. We’re very close to hitting that same resistance level right now with BLDR currently trading at $94.85. We’re also happy to buy shares of BLDR in this price range.
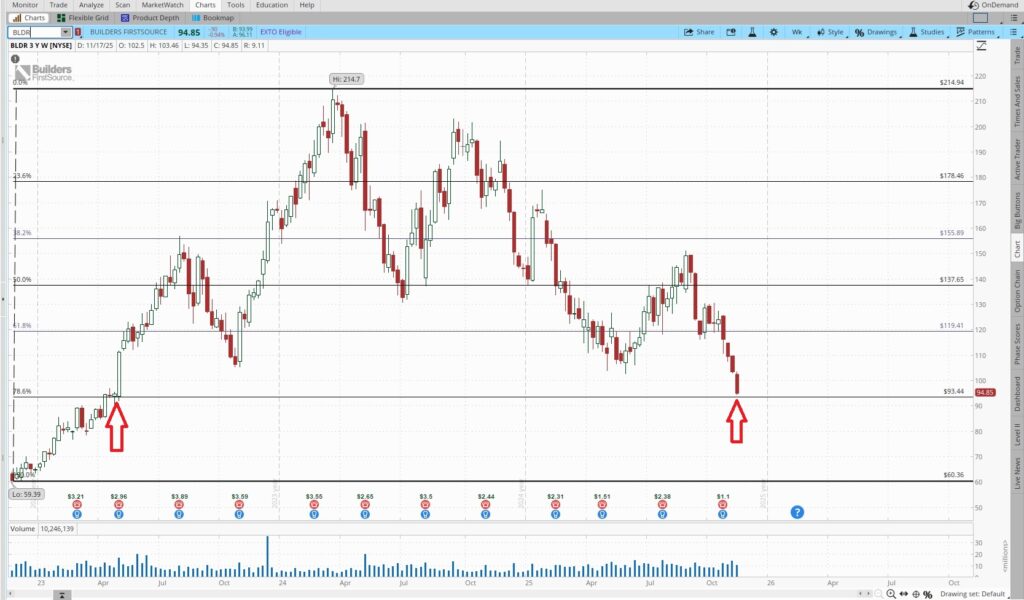
If we sell a cash secured put option to create income trading stocks we have a few things going in our favor. One, BLDR had their quarterly earnings call a few weeks ago, so we don’t need to worry about a negative earnings report right now. We have resistance line at $93, and if history repeats itself BLDR may bounce of this resistance level and work it’s way back up. If BLDR blasts down through the $93 resistance level we’ll still have some space between the current trading price and our strike price. The most important factor in our decision is that we’re happy to buy shares of BLDR in this price range. More information on our BLDR trades is available in our posts here and here. And here is our original stock option trade on BLDR.
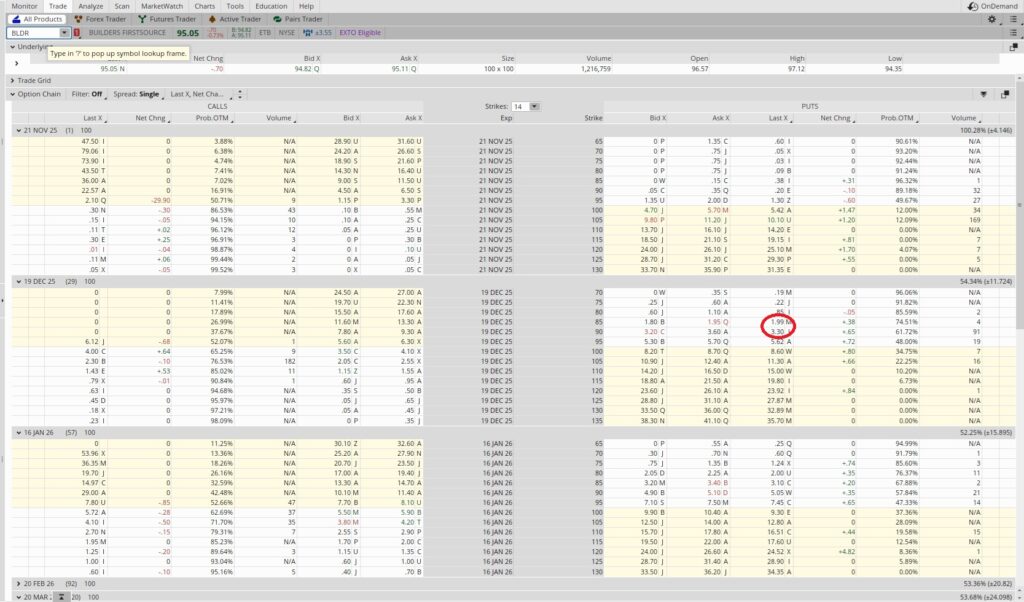
With BLDR pushing against the resistance line at $93 we want to give ourselves a little space between the current trading price and our strike price. We also want our strike price to be below the $93 resistance level. So we could sell the $90 put or the $85 put option. Let’s walk through that comparison. BLDR only has monthly option contracts available, so this will be a one month long trade. We know there are twelve months in a year, so we could do this trade (or a similar trade on a different company we like) twelve times over the course of a year. That makes our time multiplier 12. Now let’s look at the strikes.
When we sell to open a put option we’re making a promise to buy shares of the company at the strike price. Each contract is for 100 shares, so if we sell the $85 put option, we need to have 100 x $85, or $8,500, available in our brokerage account to do that trade without using margin. If we sell to open the $90 put option we’ll need $9,000 available in our account. So let’s compare the two.
With BLDR trading at $94.85 the $85 strike is nearly $10 out of the money and the $90 strike is almost $5 out of the money. The option premium for the $85 strike is less than the option premium for the $90 strike for a couple. One is that the $85 strike is further away from the money, so it’s less likely to be executed. Another reason is the strike price is lower, so we’re risking less money by agreeing to buy shares for $85 than we would if we were to agree to buy shares for $90. Since we want to create income trading stocks, we want to maximize our earnings potential while minimizing our risk. So let’s go through the math.
The premium for the $85 strike is $1.99. We divide that $1.99 into the $85 strike and we get 0.0234. Then we multiply that by our time multiplier, which in this case is 12. So 0.0234 x 12 is 0.281. That’s an annualized return of 28.1%. That’s solid. Here is the option contract return calculator we use to do that analysis.
Now let’s look at the $90 strike. The option premium for the $90 cash secured put option contract is $3.30. We divide that into the $90 strike price and we get 0.0367. Then we multiply that by 12 and we get 0.439. That’s an annualized return of 44%. That’s even better. Would we rather make an annualized return of 28.1% on $8,500 or an annualized return of 44% on $9,000?
In this case, we’re only halfway into our position in BLDR, so we’d like to be more aggressive here. We also have that resistance line around $93 that is likely, but not guaranteed, to slow down a price move below that level. So we’re going to go ahead with the $90 strike and take the 44% annualized return.
We also have a covered call option contract at the $130 strike price that expires tomorrow, 11/21. We feel that BLDR is likely to bounce up off the $93 support level, so we’re to wait to sell another covered call on any of our shares. If BLDR bounces up we’ll sell a covered call. Here we discuss how we use that wheel option strategy to create income trading stocks in more detail.
Stock Trade Recap
We sold to open the $90 put for the 12/19 expiration date for $3.30 per share in option premium. We currently hold 300 shares of BLDR in this portfolio. Using this strategy to create income trading stocks we’ve worked our basis down to $103.86 per share. Here is the trade history template we use to track our basis.